The latest traffic volume trends from the Federal Highway Administration show that the pandemic pause is over when it comes to Americans hitting the highway.
Figures released in October show that through August, cumulative travel for 2021 was up 12.2 percent with 2,068.8 billion vehicle miles of travel, an increase of 224.4 billion vehicle miles from the previous year.
Even more encouraging is that vehicle miles traveled by all vehicles on all interstate highways for the week ending Oct. 24, 2021, was up from pre-pandemic levels with 16.4 billion vehicles, a 1 percent increase from the same week in 2019.
Convenience Store News reports that, “after a tumultuous 2020 for holiday travel, airports and roads will be more jam-packed this year as travelers make their way to their Thanksgiving destinations.”
40 Million Americans Refuel Every Day
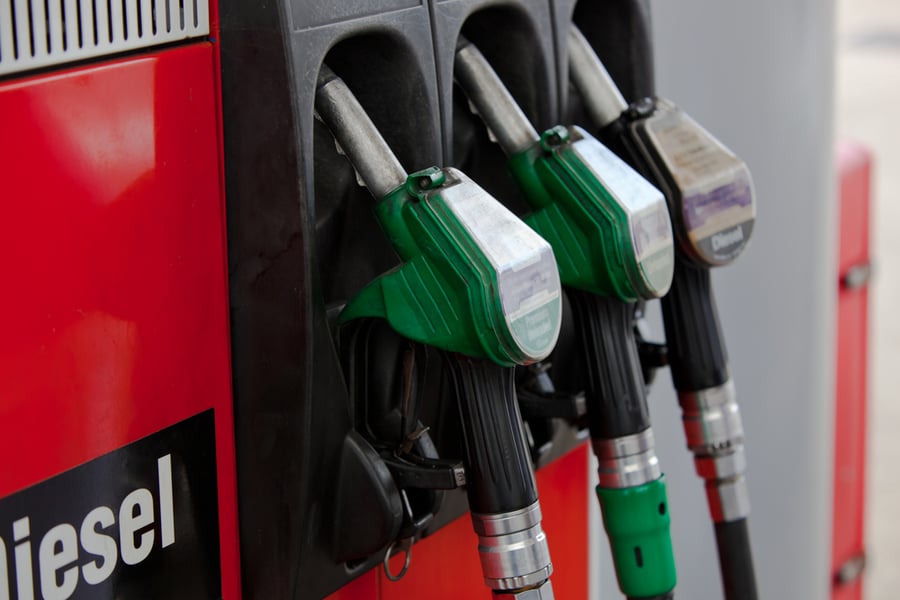
The National Association of Convenience Stores (NACS) estimates that some 40 million Americans need to refuel their vehicles every day.
To meet this demand, according to the NACS, the convenience and fuel retailing industry employs 2.5 million people in the U.S. – from store clerks to truck drivers – and generates about $550 billion in sales.
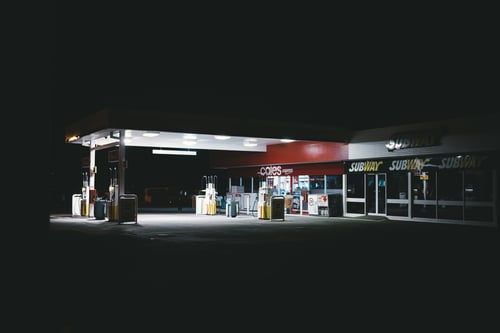
The 152,000 convenience stores nationwide account for 80 percent of fuel purchased.
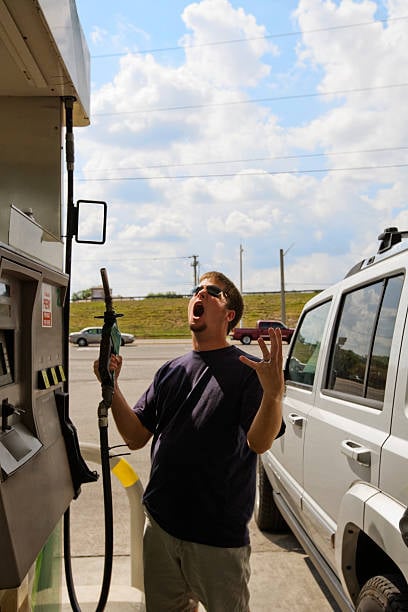
9 Daily Behaviors at the Pump
The NACS is 2019 examined the habits of gas-buying customer and found nine trends among gas-buying customers:
- Consumers Typically Decide to Buy Gas When:
- 58 percent when they are running low and it’s convenient to stop
- 17 percent perhaps often because they keep the tank as full as possible
- 11 percent when their low gas indicator light comes on
- 9 percent when they spot a cheap gas price
- 4 percent always buy gas on a specific day and time
- 1 percent when they are going inside the store to buy something
- Mid-day is Popular Pump Time:
For the past two years, mid-day between 10 a.m. and 3 pm. has been the most popular time to fill up. Women (40 percent) and Baby Boomers age 65+ (61 percent) were the groups most likely to stop by the pump mid-day. For all groups the time they often purchased gas was:
- Morning (6 to 10 a.m.) 22 percent
- Mid-day (10 a.m. to 3 p.m.) 37 percent
- Afternoon (3 to 7 p.m.) 33 percent
- Night (7 p.m. to 12 a.m.) 7 percent
- Gas Price Determines Where Drivers Shop:
- Price 59 percent
- Location of store or station 23 percent
- Store or station brand 10 percent
- Ease of entrance and/or exit 4 percent
- Quality of in-store items: 3 percent
- Consumers Largely Rely on the Gas Price Sign:
Millennial drivers more than any other age group (68 percent) decided on where to refuel by looking at the store’s gas sign. For all age groups the decision was based on:
- 63 percent said the store’s gas price sign
- 16 percent said the store’s loyalty card or other gas discounts
- 11 percent said the store’s reputation for low prices
- 9 percent said the price posted on a website or app
- How Consumers Pay at the Pump:
The popularity of cash as payment continued to decline while younger drivers such as Millennials prefer debit cards (52 percent) and older drivers such as Baby Boomers prefer credit cards (68 percent). Women were also more likely to use debit cards (43 percent) than men (35 percent). Overall method used to pay for gas:
- Credit card 39 percent
- Debit card 39 percent
- Cash 21 percent
- Filler up? Most Do, Especially Older Drivers
Most drivers opt to top off their tanks when they stop for gas, especially Baby Boomers with 90 percent filling it up, compared to just 60 percent of consumers under the age 35. Behavior among all age groups:
- Fill the tank 70 percent
- Purchase enough gas for the money budgeted 13 percent
- Spend the amount of money on hand 11 percent
- Buy a set gallon amount each time 5 percent
- Spend the amount leftover from another purchase 2 percent
- Almost Half of Gas-Buying Customers Go Inside the Store
Men are more likely (52 percent) than women (36 percent) to go inside the convenience store when buying gas. When customers do go inside the store, here is what they typically purchased:
- 45 percent gas at the register
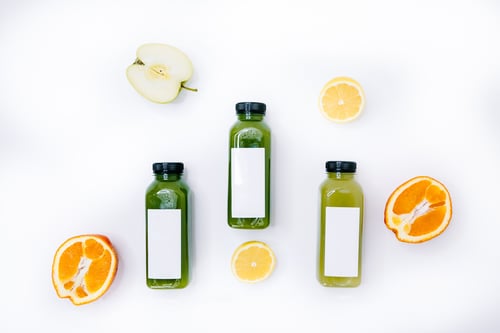
- 42 percent beverages
- 37 percent snacks
- 23 percent lottery tickets
- 21 percent cigarettes
- 11 percent grocery items
- 11 percent beer/wine
- 7 percent sandwich or meal
- Customers Do Not Shop for Gas in the Same Order
Some drivers prefer to buy gas first (41 percent) before going in the store, while others go inside the store (58 percent) and then buy their gas. There were regional variations with Midwesterners twice as likely (57 percent) to buy gas first than those in the west (29 percent). Drivers age 65+ were also more likely to buy gas first (55 percent) than those under age 35 (39 percent). Almost half of drivers leave their vehicle at the pump (45 percent) while going inside the store while 34 percent repark after fueling and 20 percent go inside the store while actively fueling at the pump.
- Dining Behaviors
Most of the food, snacks and beverages bought at convenience stores are consumed quickly with 83 percent gone within the first hour of purchase. Where they eat and drink what they bought:
- 60 percent inside the car
- 27 percent at their destination
- 12 percent at the store/use in-store seating
Contact PWM today to find out how our high-quality electronic price signs can capture the attention of the gas-buying customers.